1
2
3
4
5
6
7
8
9
10
11
12
13
14
15
16
17
18
19
20
21
22
23
24
25
26
27
28
29
30
31
32
33
34
35
36
37
38
39
40
41
42
43
44
45
46
47
48
49
50
51
52
53
54
55
56
57
58
59
60
61
62
63
64
65
66
67
68
| import numpy as np
from matplotlib_inline import backend_inline
from d2l import torch as d2l
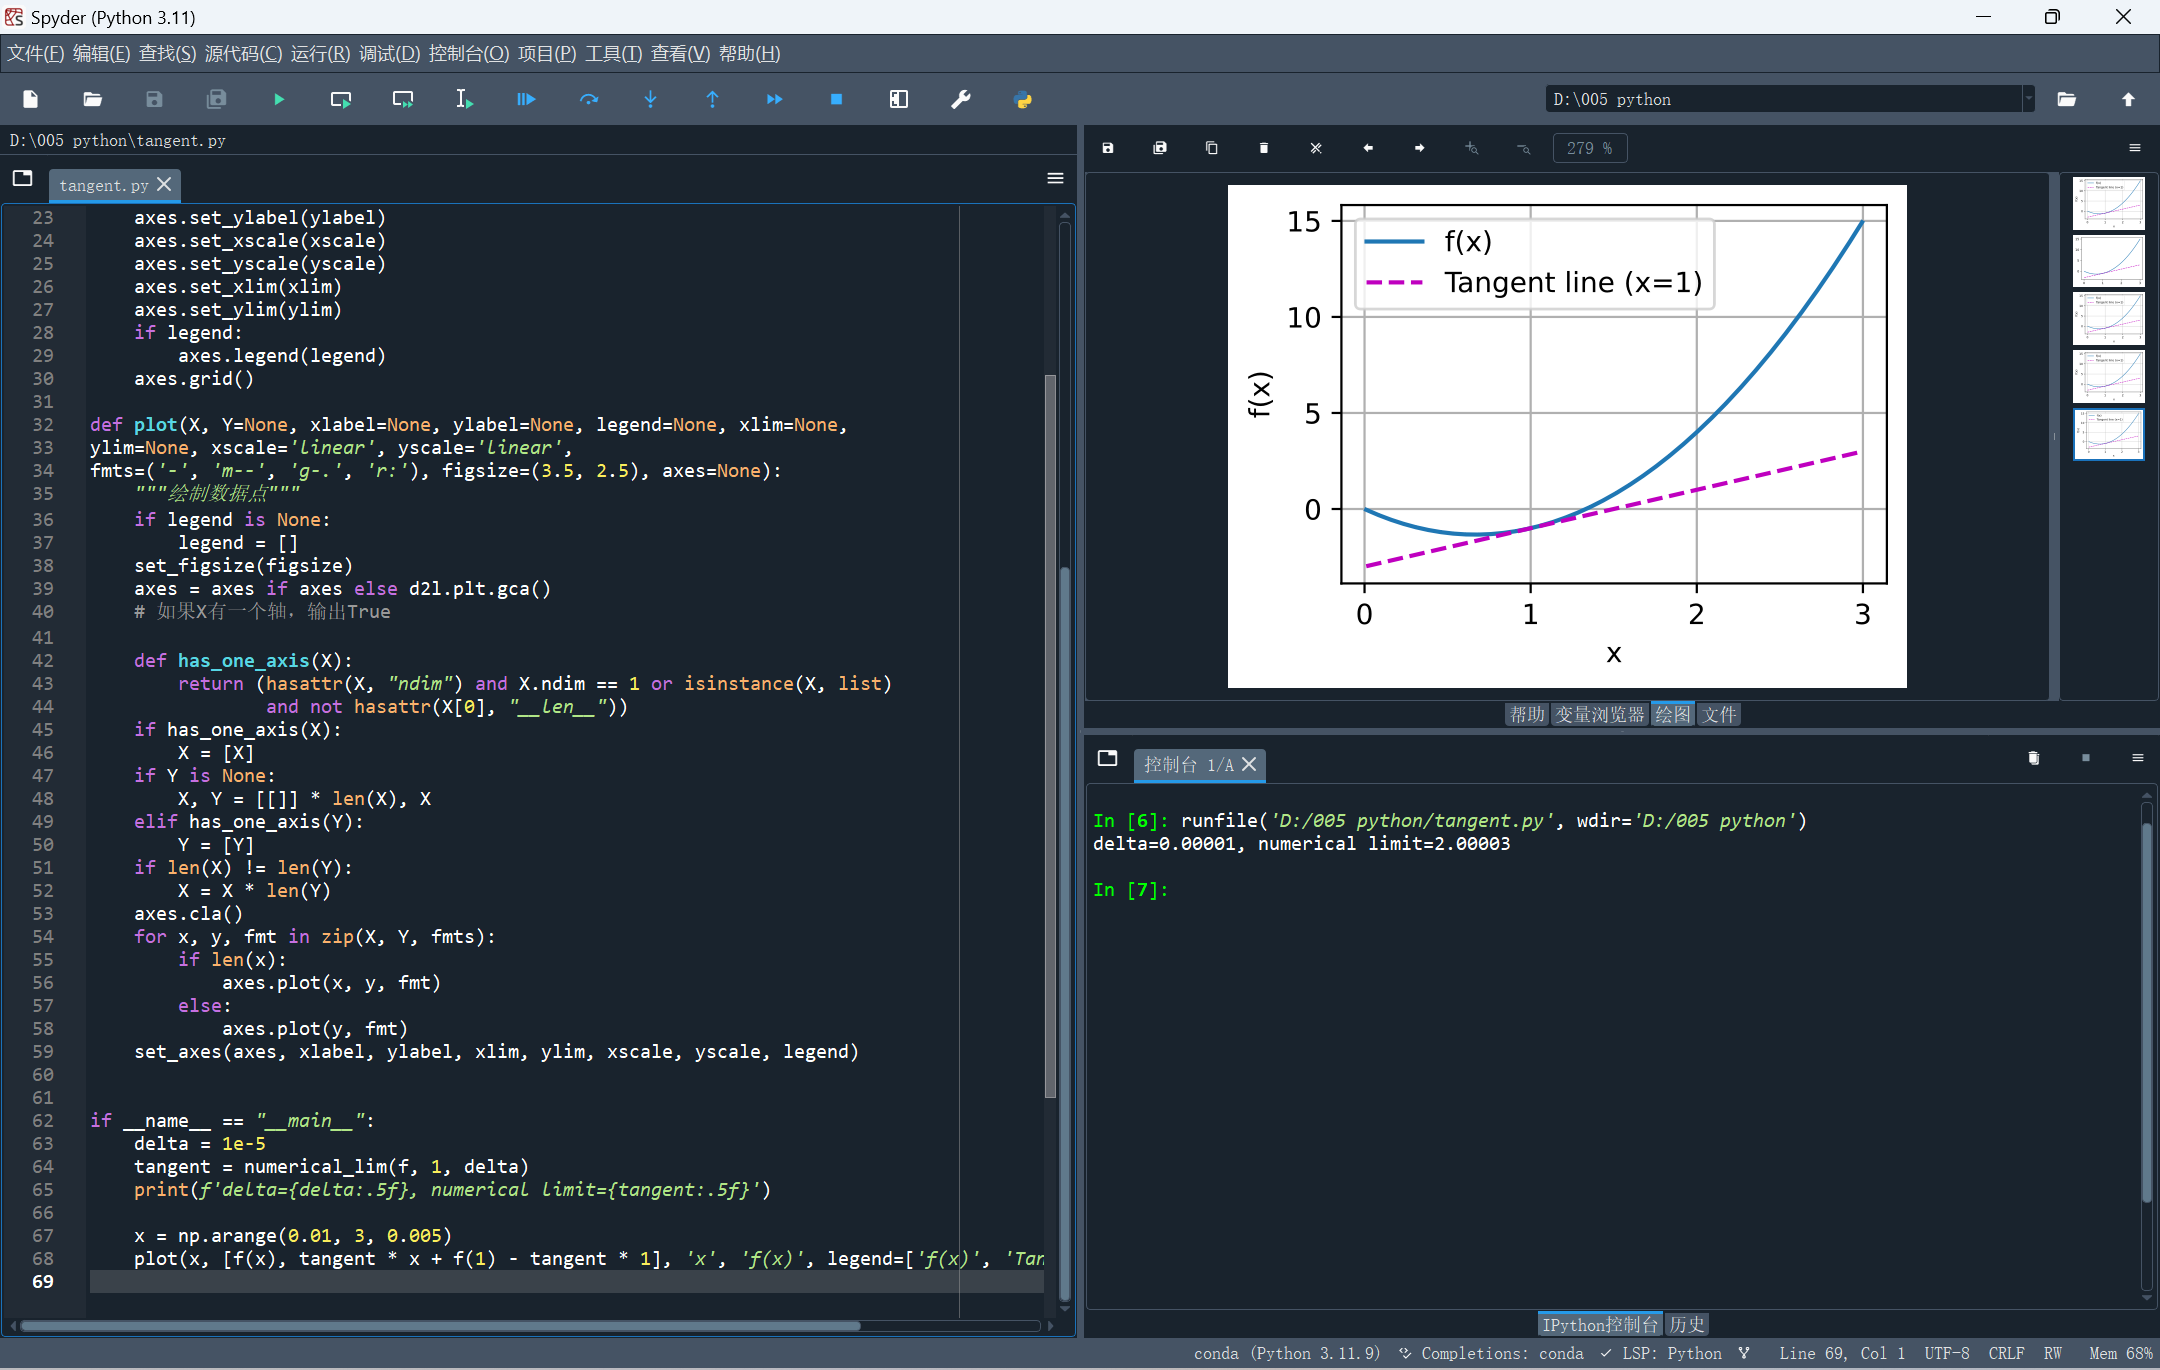
def f(x):
return 3 * x ** 2 - 4 * x
def numerical_lim(f, x, delta):
return (f(x + delta) - f(x)) / delta
def use_svg_display():
"""使用svg格式在Jupyter中显示绘图"""
backend_inline.set_matplotlib_formats('svg')
def set_figsize(figsize=(3.5, 2.5)):
"""设置matplotlib的图表大小"""
use_svg_display()
d2l.plt.rcParams['figure.figsize'] = figsize
def set_axes(axes, xlabel, ylabel, xlim, ylim, xscale, yscale, legend):
"""设置matplotlib的轴"""
axes.set_xlabel(xlabel)
axes.set_ylabel(ylabel)
axes.set_xscale(xscale)
axes.set_yscale(yscale)
axes.set_xlim(xlim)
axes.set_ylim(ylim)
if legend:
axes.legend(legend)
axes.grid()
def plot(X, Y=None, xlabel=None, ylabel=None, legend=None, xlim=None,
ylim=None, xscale='linear', yscale='linear',
fmts=('-', 'm--', 'g-.', 'r:'), figsize=(3.5, 2.5), axes=None):
"""绘制数据点"""
if legend is None:
legend = []
set_figsize(figsize)
axes = axes if axes else d2l.plt.gca()
def has_one_axis(X):
return (hasattr(X, "ndim") and X.ndim == 1 or isinstance(X, list)
and not hasattr(X[0], "__len__"))
if has_one_axis(X):
X = [X]
if Y is None:
X, Y = [[]] * len(X), X
elif has_one_axis(Y):
Y = [Y]
if len(X) != len(Y):
X = X * len(Y)
axes.cla()
for x, y, fmt in zip(X, Y, fmts):
if len(x):
axes.plot(x, y, fmt)
else:
axes.plot(y, fmt)
set_axes(axes, xlabel, ylabel, xlim, ylim, xscale, yscale, legend)
if __name__ == "__main__":
delta = 1e-5
tangent = numerical_lim(f, 1, delta)
print(f'delta={delta:.5f}, numerical limit={tangent:.5f}')
x = np.arange(0.01, 3, 0.005)
plot(x, [f(x), tangent * x + f(1) - tangent * 1], 'x', 'f(x)', legend=['f(x)', 'Tangent line (x=1)'])
|